
Copy This ROI Checklist and Cost Ledger to Calculate Marketing ROI
The core formula is simple: ROI = (Revenue − Marketing Cost) ÷ Marketing Cost × 100. The part most guides skip is which number belongs in the numerator. Use attributed revenue for quick reads, but contribution profit for any decision that affects budget, because it accounts for margin instead of treating every dollar of revenue as pure gain. Whatever basis you pick, publish it next to the ROI figure along with the measurement window, whether that’s 30, 90, or 365 days, since the same campaign can show a healthy number at one horizon and a losing one at another.
TL;DR:
- Using contribution profit instead of revenue for ROI provides a more accurate picture of campaign profitability, especially for low-margin products.
- Accurately defining costs—including agency fees, software, and internal labor—and tracking them consistently prevents inflated ROI estimates.
- Choosing the correct attribution model (first-touch, last-touch, or data-driven) significantly impacts ROI figures and should align with campaign goals.
- Extending the measurement window beyond 30 days captures long-term customer value, especially for awareness and retention campaigns.
- Blended ROI across multiple channels, calculated with a shared attribution model, offers the most realistic view of overall marketing effectiveness.
Table of Contents
- How Do You Calculate Marketing ROI Correctly?
- What Should You Count as Marketing Cost and Return?
- How Do Attribution Models Change Your ROI Number?
- How Do You Fold Lifetime Value Into ROI?
- Which KPIs Should You Track Alongside ROI?
- What Does a Worked ROI Example Look Like?
- What Mistakes Most Often Inflate Reported ROI?
- How Does Dot Xero Approach ROI Measurement?
- How Do You Adjust ROI for Offline Marketing?
- What Tools Help Automate ROI Tracking?
- How Do You Calculate ROI Across Multiple Channels?
- How Should ROI Results Change Your Strategy?
- An Editorial Note on Precision Versus Speed
- How Dot Xero Can Help You Measure and Improve ROI
- Sources
- FAQ
How Do You Calculate Marketing ROI Correctly?
Marketing ROI isn’t one formula. It’s a family of them, and picking the wrong variant for the question you’re actually asking is the single most common measurement mistake.
Simple ROI is the entry point: (Revenue − Cost) ÷ Cost × 100. If a campaign cost $10,000 and generated $25,000 in attributed revenue, that’s a 150% ROI. Clean, fast, and fine for a gut check. But revenue isn’t profit, and a campaign that drives high revenue on low margin products can look great on this formula while barely breaking even in reality.
Profit-based ROI fixes that by swapping revenue for gross or contribution margin: (Contribution Profit − Cost) ÷ Cost × 100. If that same $25,000 in revenue carries a 40% contribution margin, your actual return is $10,000 in profit against $10,000 in cost, which is 0% ROI, not 150%. This is the number that should drive budget decisions, and the AMA’s guidance on return on marketing investment makes the same case: ROMI should be calculated on net marketing contribution, not top-line revenue.
ROAS (Return on Ad Spend) is revenue divided by ad spend, and it’s easy to mistake for ROI because the math looks similar. It isn’t the same thing. ROAS typically excludes agency fees, creative production, software, and labor, so a channel showing 4:1 ROAS can still post negative ROI once the full cost stack gets counted. Amazon Ads is explicit about this distinction: ROI includes the full investment base and subtracts cost from return, while ROAS only measures ad efficiency.
Use each formula for what it’s built for:
- Simple ROI for fast, directional checks early in a campaign
- Profit-based ROI for any budget reallocation or renewal decision
- ROAS for comparing raw media efficiency across ad platforms
- LTV-adjusted ROI for campaigns where the first sale is just the entry point, like subscriptions, retention offers, or high-ticket services with repeat purchases
What Should You Count as Marketing Cost and Return?
An ROI number is only as good as what went into building it. Skip a cost category and the ROI looks inflated. Miscount the return and it looks disconnected from reality either way.
- Define the measurement period and objective first. Are you measuring a single campaign’s launch window, a quarter of always-on spend, or a full customer lifecycle? The objective (leads, sales, sign-ups) determines what counts as a valid return.
- Total every attributable cost. That means media spend, agency or freelancer fees, creative and production costs, software and platform fees, tracking and analytics setup, and a reasonable allocation of internal staff time. Salesforce’s ROI framework lists this same set of cost categories as the baseline for a decision-grade calculation.
- Set allocation rules before you need them. If one designer splits time across three campaigns, decide up front whether you allocate by hours logged, by revenue share, or by a flat percentage. Whatever rule you pick, apply it consistently across campaigns so comparisons hold up.
- Publish the numerator definition beside the ROI figure. State plainly whether the return is gross revenue, attributed revenue, or contribution profit. A campaign labeled “312% ROI” means something completely different depending on which basis produced it.
Pro Tip: Keep a running campaign cost ledger in a shared spreadsheet, updated weekly, not just at campaign close. Teams that reconstruct costs after the fact almost always miss software fees and internal labor, which is the most common way ROI gets accidentally inflated.
Missing a cost category doesn’t just shrink your ROI number slightly. It can flip a losing campaign into an apparent winner, which is exactly the scenario Google Analytics’ measurement guidance warns against: an incomplete denominator is one of the most common and hardest to catch errors in campaign reporting.
How Do Attribution Models Change Your ROI Number?
The same campaign data can produce three different ROI figures depending on which attribution model assigns the credit. This isn’t a rounding error. It’s a structural difference in how conversions get counted.
- First-touch attribution gives full credit to the first interaction a customer had with your brand, which rewards awareness channels like display and social.
- Last-touch attribution gives full credit to the final click before conversion, which tends to overweight search and retargeting.
- Position-based and time-decay models split credit across the path, weighting the first and last touch more heavily, or giving more credit to touches closer to conversion.
- Data-driven attribution uses your own account data to assign credit based on actual conversion patterns rather than a fixed rule.
Attribution is an assumption about causation, not proof of it. Simple heuristics like weighted first and last touch have been shown to outperform unvalidated sophisticated models for some firms, particularly when data volume is too thin to support a data-driven model reliably.
Model choice doesn’t just change reporting. It changes automated bidding, too. Google Ads’ own attribution documentation notes that switching models changes which conversions get credited, which directly feeds automated bid strategies. Get the model wrong and you’re not just misreporting ROI, you’re actively steering ad spend toward the wrong channels. Google recommends testing a non-last-click model and comparing results before changing bidding behavior based on it.
The most reliable way to cut through model bias is to stop trusting attribution alone and run an experiment. Holdout tests, where you withhold marketing from a control group and compare outcomes to an exposed group, and geographic holdouts, where you pause spend in select markets, both estimate incrementality directly rather than inferring it from a model. If you manage paid search or display at scale, Dot Xero’s Google Ads management work centers on this kind of tracking setup, precisely because attribution model selection has such a large downstream effect on reported ROI and bid automation.
How Do You Fold Lifetime Value Into ROI?
First-purchase ROI tells you whether a campaign broke even on day one. It doesn’t tell you whether that customer is worth pursuing at all. LTV-adjusted ROI fixes that by extending the return side of the formula across the customer relationship instead of stopping at the first transaction.
The formula: LTV-Adjusted ROI = ((Average Customer LTV × Contribution Margin) − Acquisition Cost) ÷ Acquisition Cost × 100. The inputs you need are average order value, purchase frequency, contribution margin, retention rate, and a defined time horizon.
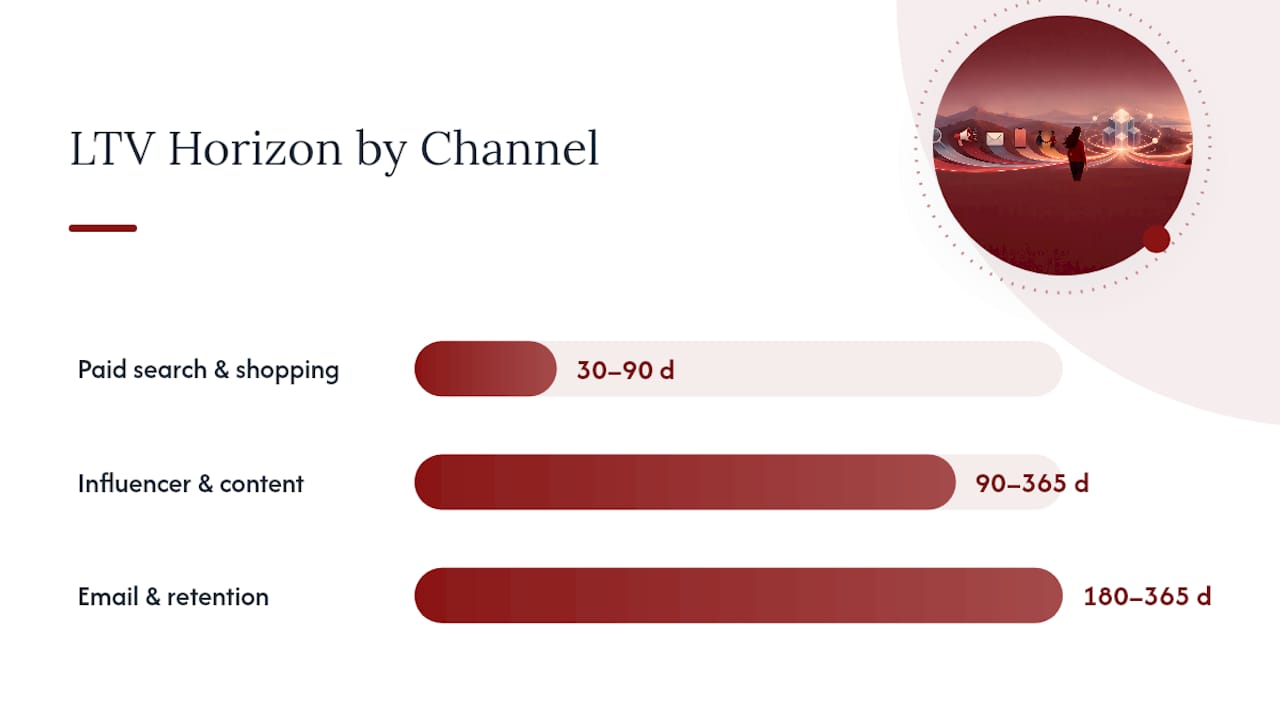
That horizon matters more than most calculations acknowledge. A campaign can look like a loser at 30 days and a clear winner at 365, or the reverse, depending on how quickly customers churn versus how quickly they repeat-purchase. The AMA’s Influencer Marketing ROI Calculator is built around exactly this problem: it models cost, conversions, margin, and retention across 30, 90, and 180 day windows so influencer campaigns get judged on the right timeline instead of a single snapshot.
Match the horizon to the campaign type:
- Paid search and shopping ads convert fast, so a 30 to 90 day window usually captures the meaningful return.
- Influencer and content campaigns build awareness that pays off slowly, so judge them at 90 to 365 days, not 30.
- Email and retention campaigns exist specifically to extend customer relationships, which means their real value only shows up in a 180 to 365 day LTV view.
There’s no universal “good” ROI ratio, because break-even economics vary by margin, fulfillment cost, and retention rate from one business to the next. A 3:1 revenue-to-cost ratio might be a strong result for a low-margin retailer and a weak one for a high-margin subscription service.
Which KPIs Should You Track Alongside ROI?
ROI tells you whether a campaign paid off. It doesn’t tell you why, or where to push spend next. That’s what these five metrics are for.
- ROAS (ad revenue ÷ ad spend) measures raw media efficiency but excludes most non-media costs, so it can look strong even when full ROI is negative.
- CAC (Customer Acquisition Cost) is total acquisition spend divided by new customers gained, and it’s the number that should shrink as campaigns mature.
- CPA (Cost Per Acquisition) narrows CAC down to a single campaign or channel, useful for comparing apples to apples across platforms.
- Conversion rate shows how efficiently traffic turns into customers, and a low rate here often explains a disappointing ROI even when traffic volume looks healthy.
- Contribution margin is the profit left after variable costs, and it’s the multiplier that turns revenue-based ROI into profit-based ROI.
The gap that trips up the most teams: a campaign can post a strong 5:1 ROAS while showing negative profit-based ROI, if the product’s contribution margin is thin enough that ad spend eats most of the gross revenue. That’s why ROAS alone should never greenlight a budget increase.
Marginal ROI, the return on the next dollar spent rather than the average return on all dollars spent, is the sharper decision tool here. Consumer response to marketing tends to show diminishing returns as spend increases, so comparing campaigns purely on overall ROMI can be misleading. Compare at similar spend levels, or look at marginal ROI specifically, before deciding where the next dollar goes.
What Does a Worked ROI Example Look Like?
Here’s a campaign with real numbers plugged into every formula covered so far, so you can see how the same data tells different stories depending on which lens you apply.
- List every cost. Media spend $8,000, agency fee $1,500, creative production $800, tracking software $200, allocated internal labor $500. Total cost: $11,000.
- Record attributed revenue at each horizon. 30 days: $18,000. 90 days: $27,000 (repeat purchases from the same cohort). 180 days: $34,000.
- Apply a 45% contribution margin to convert revenue into profit at each horizon.
- Calculate ROAS, simple ROI, and profit-based ROI side by side to compare.
| Metric | 30 days | 90 days | 180 days |
|---|---|---|---|
| Attributed revenue | $18,000 | $27,000 | $34,000 |
| ROAS (revenue ÷ media spend) | 2.45:1 | 3.68:1 | 4.09:1 |
| Contribution profit (45% margin) | $8,100 | $12,375 | $15,300 |
| Simple ROI (revenue basis) | 64% | 150% | 198% |
| Profit-based ROI (contribution basis) | −26% | 10% | 40% |
Notice the gap: at 30 days, simple ROI shows a healthy 64% while profit-based ROI is actually negative at −26%, because the $8,100 in contribution profit hasn’t yet covered the $11,000 in total cost. It takes until somewhere between 90 and 180 days for this campaign to become genuinely profitable on a margin basis, even though ROAS looked reasonable from day one.
For your own spreadsheet template, the inputs to paste in are: total cost by category, attributed revenue by horizon, contribution margin percentage, and the formulas above applied as columns. That’s the whole build. No macros required.
What Mistakes Most Often Inflate Reported ROI?
The same handful of errors show up in almost every inflated ROI report, and every one of them is preventable with a checklist run before launch.
The recurring mistakes:
- Omitting agency fees, software costs, or internal labor from the denominator
- Using a lookback window that’s too short for the sales cycle, which undercounts revenue
- Crediting a sale to the wrong channel because of a broken or missing attribution model
- Comparing revenue-based ROI on one campaign to profit-based ROI on another
- Reporting ROI without stating the measurement window or numerator definition
Pre-launch checklist:
- Define the campaign objective and success metric
- Choose the attribution model and document why
- Confirm tracking and conversion pixels are firing correctly
- Build the cost ledger with every category included
Post-launch checklist:
- Validate that conversion data matches CRM or sales records
- Run a holdout or geo experiment if the budget and timeline allow
- Publish the numerator definition and measurement window alongside the final ROI number
Pro Tip: Run your post-launch checklist even on campaigns that “obviously worked.” The campaigns that look like clear wins are exactly the ones nobody double-checks, and that’s where misattributed sales quietly pad the numbers most.
How Does Dot Xero Approach ROI Measurement?
Since 2007, marketing plans for businesses across industries have been built and measured against the same discipline covered above: a real cost ledger, a stated attribution approach, and a clear return basis.
In practice, that means:
- Building the cost ledger before a campaign launches, not reconstructing it afterward
- Modeling LTV for email and retention-focused clients through email marketing programs, since first-purchase ROI alone undersells what a good retention campaign is worth
- Reporting results transparently, with the numerator and measurement window stated, instead of leading with vanity metrics
Clients working across multiple channels can request an ROI audit or a copy of the calculation template outlined in this article to apply to their own campaign data.
How Do You Adjust ROI for Offline Marketing?
Offline campaigns, print ads, radio spots, trade show sponsorships, direct mail, don’t come with a click to trace. That doesn’t mean they’re unmeasurable, but it does mean you need a substitute for the tracking pixel.
The most reliable fix is a unique identifier tied specifically to the offline touchpoint: a dedicated phone number, a landing page URL printed only on that mailer, a promo code exclusive to that trade show booth, or a QR code that routes to a tracked page. Tools built for short-term promotional tracking, like Get Reward QR, exist specifically to bridge this gap by giving an offline touchpoint a trackable digital signature without needing a full attribution platform behind it.
Where a unique code isn’t practical, fall back on lift testing: compare sales or lead volume in markets running the offline campaign against a matched control market that isn’t. This is the same holdout logic used to validate digital attribution models, applied to a channel that has no native tracking.
For costs, offline campaigns often carry expenses that are easy to underestimate: print production, media buys, booth rental, shipping for direct mail, and staff travel time for events. Fold all of it into the same cost ledger you’d use for a digital campaign, because a trade show that “felt successful” but cost $15,000 in untracked expenses can still post a negative profit-based ROI once the full number gets counted.
Finally, keep the measurement window generous. Offline campaigns typically influence buyers over a longer arc than a paid search ad, so a 30 day lookback will understate the real return more often than not.
What Tools Help Automate ROI Tracking?
Spreadsheets work for a single campaign. They fall apart fast once you’re running five channels simultaneously and trying to reconcile attribution across all of them by hand.
Most marketing teams end up layering three types of tools. Analytics platforms (like Google Analytics) handle the tracking and conversion data collection that feeds every ROI formula covered here, and Google’s own measurement guidance is worth reviewing directly if you’re setting up conversion tracking from scratch. Ad platform dashboards (Google Ads, Meta Ads Manager) report ROAS and cost data natively, but remember they won’t include your agency fees or internal labor automatically, so that math still happens outside the platform. CRM and revenue attribution tools connect the marketing touchpoint to the actual closed sale, which is the piece spreadsheets struggle with most once a sales cycle stretches beyond a single session.
For validating attribution independently of the ad platform’s own reporting, an external audit adds a useful check. A sample affiliate revenue audit report shows what that kind of independent measurement review looks like in practice, cross-checking platform-reported numbers against actual conversion data rather than taking the dashboard at face value.
Whatever combination you choose, the automation should feed the ledger and the formula, not replace the judgment call about which numerator to use. No tool decides for you whether contribution profit or attributed revenue belongs in the calculation. That’s a business decision, not a software setting.
How Do You Calculate ROI Across Multiple Channels?
Multi-channel ROI breaks in one predictable way: double-counted conversions. A customer who saw a display ad, clicked an email, and then searched your brand name before buying can get full revenue credit in three separate channel reports, making the combined ROI across channels look far higher than the business actually performed.
The fix starts with a single, shared attribution model applied consistently across every channel’s report, rather than letting each platform report its own default (Google Ads defaulting to one model, Meta to another, email software to a third). Pick one model, whether that’s data-driven, position-based, or a weighted heuristic, and apply it uniformly so credit doesn’t overlap.
From there, calculate two layers of ROI:
- Channel-level ROI, using that channel’s allocated cost against its credited revenue under the shared model
- Blended ROI, using total marketing cost across all channels against total attributed revenue, deduplicated for cross-channel overlap
Blended ROI is the number that should drive overall budget decisions, since it reflects what the combined marketing effort actually produced rather than what each channel claims individually. Channel-level ROI is still useful, but treat it as a diagnostic for where to shift spend within the existing budget, not as a standalone justification for adding more.
Shared costs need the same allocation discipline covered earlier: if one creative asset runs across paid social, email, and a landing page, split its cost across those channels using a documented rule rather than assigning it entirely to whichever channel launched first.
How Should ROI Results Change Your Strategy?
A single ROI number is a snapshot, not a strategy. The real value comes from what you do after you see it, and that response should follow a consistent logic rather than a reflex.
If profit-based ROI is strongly positive and stable across two or more measurement periods, that’s the signal to scale, but check marginal ROI first. Diminishing returns often set in as spend increases, so the version of the campaign that earns another 20% budget isn’t automatically as efficient as the version that just proved itself.
If ROI is negative but ROAS looks reasonable, the problem usually sits in the cost side, not the media side. Revisit the cost ledger before touching the ad copy or targeting, since an incomplete denominator is a more common culprit than weak creative.
If ROI varies wildly between attribution models, don’t average the results and move on. That variance is a signal that the model itself is unreliable for this campaign, and it’s worth running a holdout test to get an incrementality read that doesn’t depend on model assumptions.
If ROI looks strong at 30 days but weak at 90, or the reverse, match the horizon to the decision you’re actually making. A campaign optimized for quick wins and one optimized for retention value shouldn’t be judged on the same clock.
An Editorial Note on Precision Versus Speed
The honest trade-off in ROI measurement is between precision and timeliness, and most teams pick the wrong side of it by default. Waiting for a perfectly clean, fully validated attribution model before making a budget call means the campaign is over before you’ve decided anything useful about it.
A better minimum standard for monthly reviews: report ROI with the numerator and window stated, flag which model produced it, and treat the number as directionally correct rather than exact. Precision matters more for annual planning than for a Tuesday budget shift.
Run holdout tests when the stakes justify the effort, but don’t let the absence of one stop you from acting on the data you already have. Publish your assumptions every time. A number without its assumptions attached isn’t a measurement, it’s a guess wearing a decimal point.
— Will
How Dot Xero Can Help You Measure and Improve ROI
You can get a marketing plan built around your specific industry and honest advice about which channels will move your numbers instead of generic reporting packages.

That starts with the infrastructure ROI measurement depends on. Google Ads and Pay-Per-Click management includes tracking setup and conversion measurement built to a defined attribution model, not a default last-click assumption. Reporting dashboards and analytics work through website development give you the conversion data this article’s formulas actually run on. And for businesses where the first sale is only part of the value, email marketing campaigns get built with LTV and retention in mind, not just first-purchase revenue.
If you want a second look at how your current campaigns are being measured, request an ROI audit through Dot Xero and get a clear read on what your cost ledger and attribution model are actually telling you.
Sources
For deeper reference on the formulas and models covered here: the Salesforce marketing ROI guide walks through cost categories in detail. Amazon Ads’ ROI explainer clarifies the ROAS versus ROI distinction. The AMA’s ROMI guidance covers marginal ROI and LTV separation. Google Ads’ attribution documentation explains model comparison tools.
- How do you calculate marketing ROI? | Amazon Ads
- Using return on marketing investment effectively | AMA
FAQ
What Is a Good Marketing ROI Ratio?
There’s no single universal benchmark, since break-even economics depend on your margin, fulfillment costs, and retention rate. A 3:1 revenue-to-cost ratio is often cited as a reasonable target, but a high-margin subscription business might need far less to be profitable, while a low-margin retailer might need more.
What Is the Formula to Calculate ROI?
The standard formula is ROI = (Revenue − Marketing Cost) ÷ Marketing Cost × 100. For a profit-based version that accounts for margin, swap revenue for contribution profit, which the AMA recommends for decisions that affect budget.
What Does a 20% ROI Mean?
Whether that’s a strong result depends entirely on the numerator: 20% profit-based ROI is a much stronger signal than 20% simple revenue-based ROI.
How Do You Calculate ROI in Sales With an Example?
Take total sales revenue attributable to a campaign, subtract the full marketing cost including media, agency fees, and labor, then divide by that same cost and multiply by 100.
Does Dot Xero Help Set Up ROI Tracking?
Yes. Dot Xero builds conversion tracking and reporting dashboards into its website development and Google Ads management work, so ROI calculations rest on accurate data rather than guesswork. Pricing for these services is available directly on the Dot Xero site.